CASM Update: State of the Colorado Snowpack
CASM Stakeholders
April 1 is a key milestone for water supply planning across the West, as it typically represents peak snowpack accumulation at snow monitoring stations, and provides an early indication of runoff conditions for the coming year. Supported by the CWCB, the Airborne Snow Observatories completed an initial round of snow surveys in mid-March across most major Colorado headwater basins, providing a comprehensive, basin-wide view of snow conditions and streamflow forecasts to complement traditional station-based measurements.
Statewide ASO surveys complete across all major basins
Basin-wide measurements provide snow water equivalent volume, and a spatial context beyond point-based SNOTEL data
Key Graphics: year-over-year comparisons, NRCS vs ASO, and basin-scale summaries
First ASO airborne snow surveys of the season add important detail to a historically low snow year
With the mid-March airborne snow survey data now available, we can start to look at snowpack conditions across entire basins. A useful way to compare is to look at current snow water equivalent (SWE) against the same time last year. The maps below show mid-March SWE, along with a comparison to the closest survey from 2025. A value of 1.0 means equal to last year, 0.5 means half of last year, and so on. Very few areas are above last year, so the maps are capped at 1.0. The survey dates are not exactly the same between years, which is important context.
There is a lot of variation across and within basins. The Conejos River basin, for example, has areas close to last year’s levels, but lower elevations have very little snow. The Dolores, Taylor, and Big Thompson basins show mixed conditions, with some areas near last year and others well below.
The Blue River stands out as strongly and uniformly lower SWE in 2026 relative to last season. A look at the survey dates reveals that this is actually a double-whammy: the comparison is between March 20, 2026 and April 11, 2025. So not only is the mid-March Blue River snowpack somewhere around half that of last year, it is half of the mid-April snowpack last year. The timing difference between the years varies around the state, but generally the surveys were conducted earlier this year. In summary, the comparison patterns across Colorado
Confirm the very low snowpack indicated by the SNOTEL network,
highlight variations in SWE within watersheds that are important for local water availability,
And indicate that we are somewhere around a month early in the transition from winter accumulation to the spring snowmelt season.
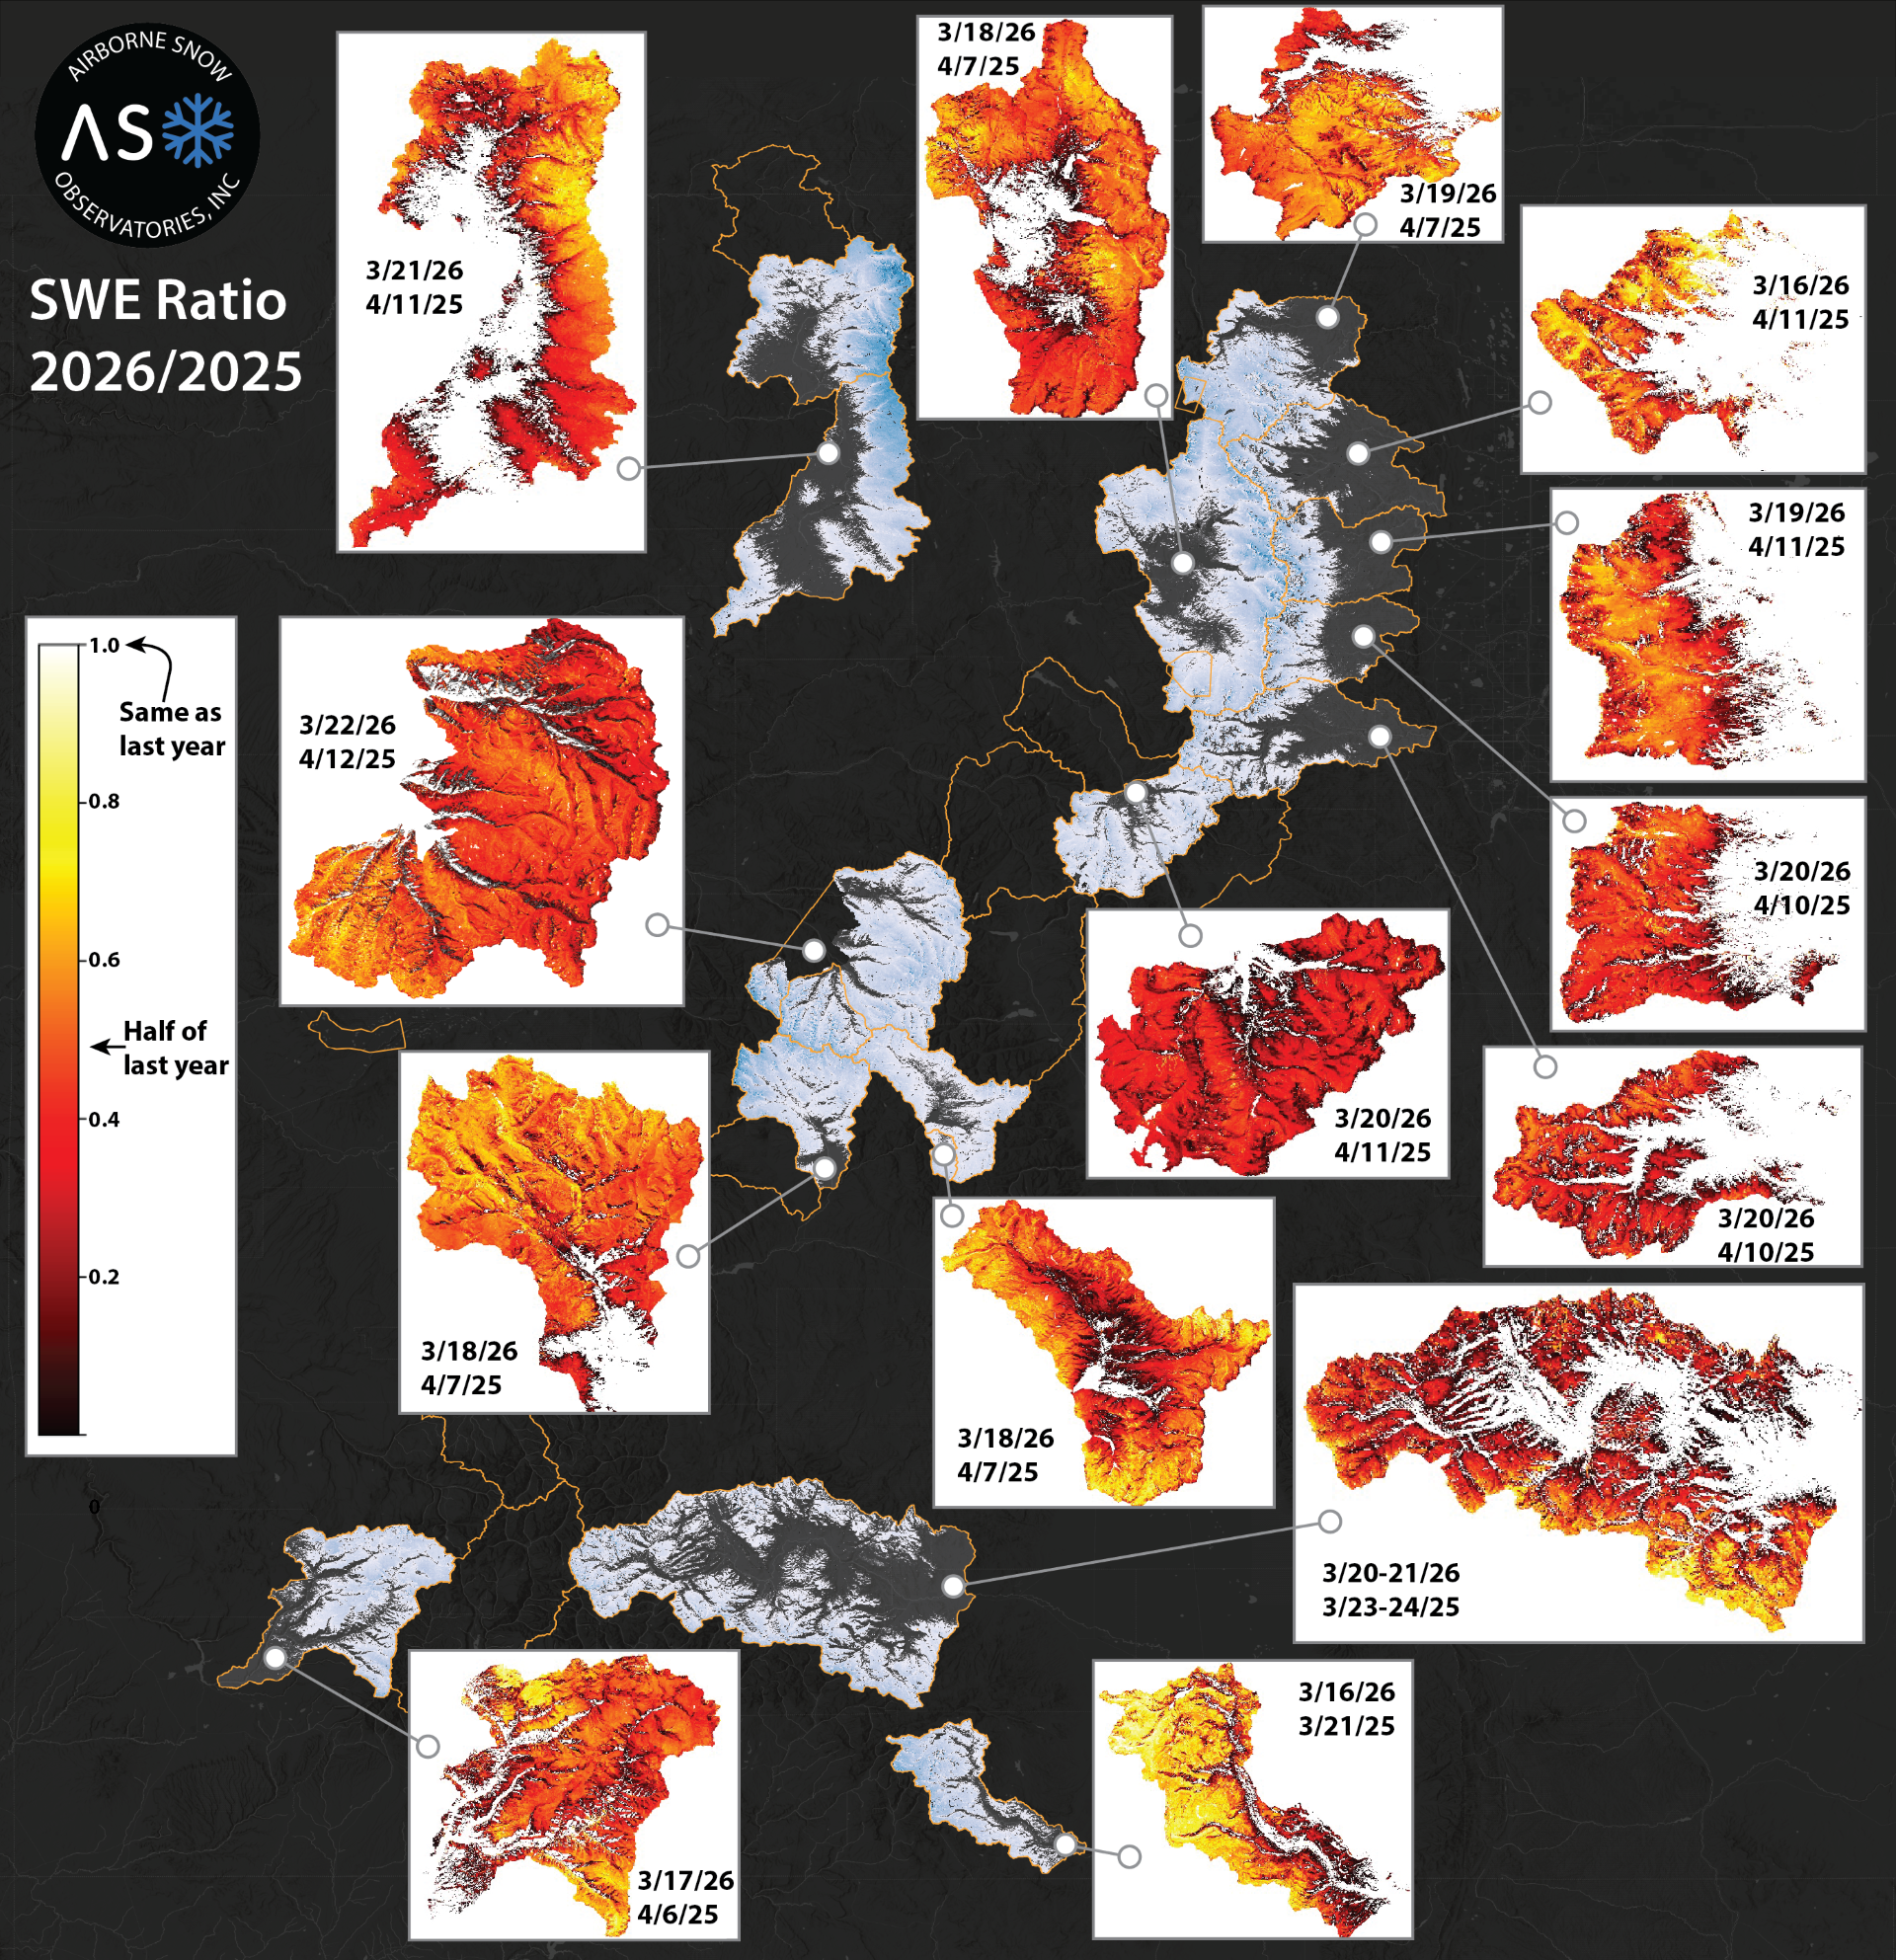
2026 / 2025 April 1st Snowpack Comparison from completed ASO Lidar Surveys (Credit ASO Inc.)
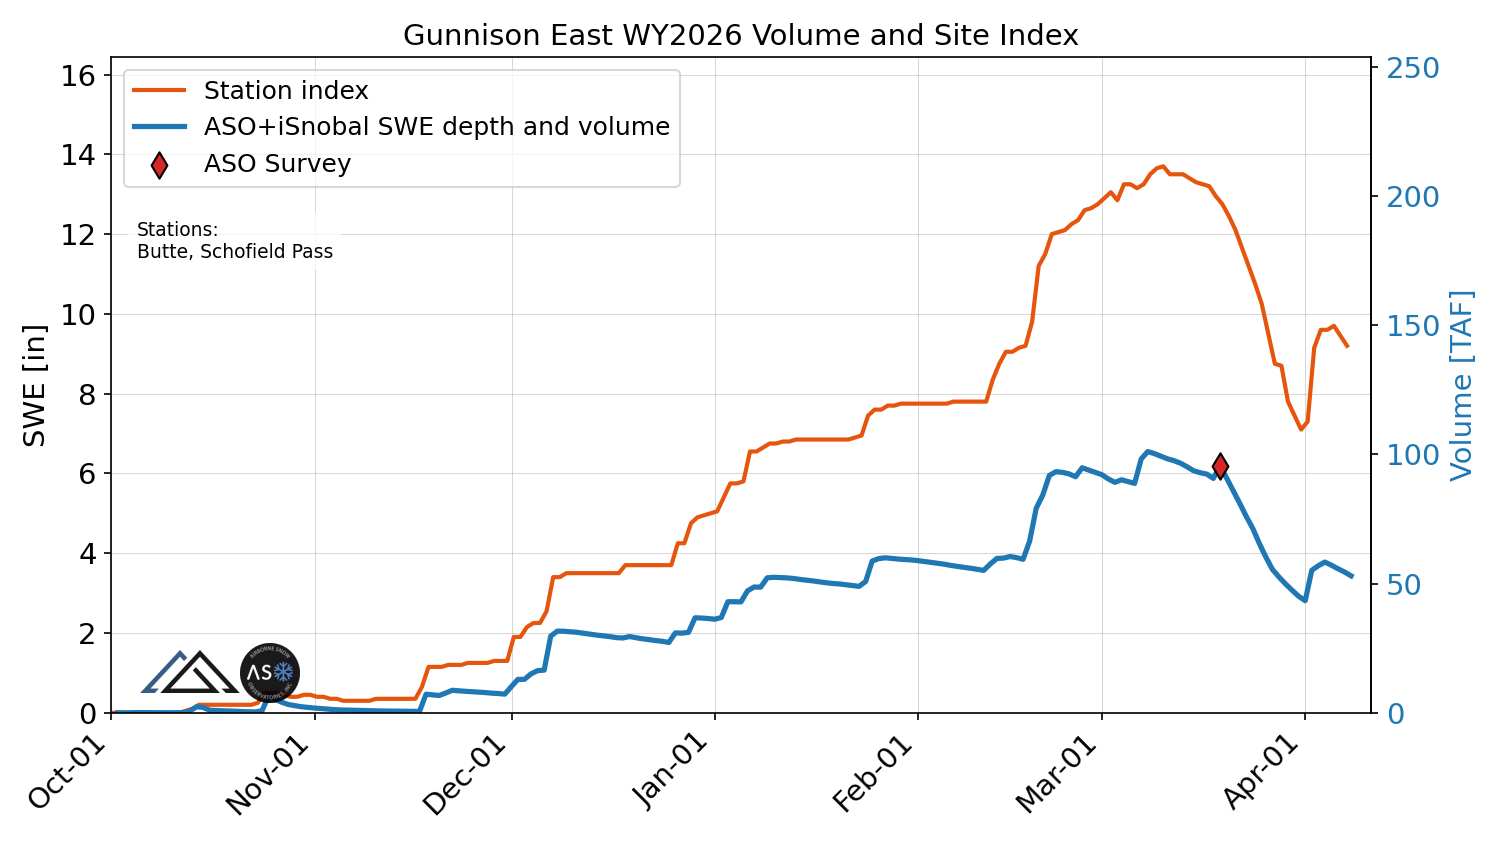
ASO continuous basin SWE tracking adds context to established station index monitoring
The iSnobal snow model used by ASO/M3Works helps convert lidar snow depth into snow water equivalent (SWE) by estimating snow density. Just as importantly, it tracks how the snowpack changes over time, including SWE and factors like cold content, which reflects how much warming is needed before melting begins.
Because the model runs continuously, we can compare full-basin SWE to the more familiar SNOTEL station index (see Figure Gallery). In the graphics, the orange line shows the SNOTEL index, which is the average SWE measured at stations in the basin. The blue line shows basin-wide SWE from the model, including both average depth and total volume. Red diamonds mark where airborne surveys were used to update the model. (The two lines are not directly comparable in magnitude, since one represents station averages and the other represents the full basin.)
Looking across Colorado basins, there is noticeable variation in how these two measures relate. In many cases, total basin SWE peaks earlier than the SNOTEL index. Sometimes the difference is small, but in other basins it can be weeks.
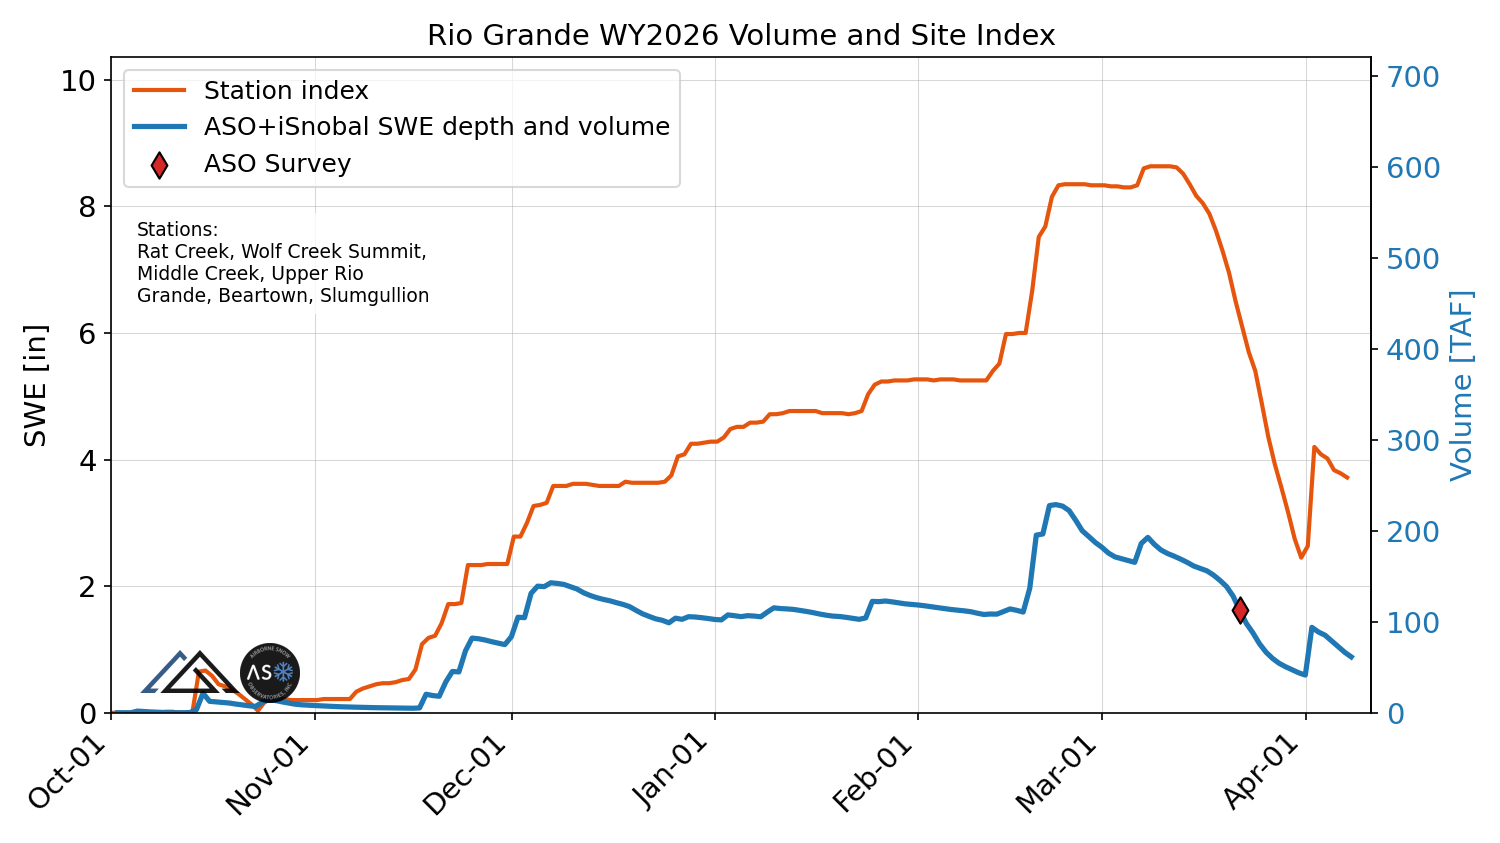
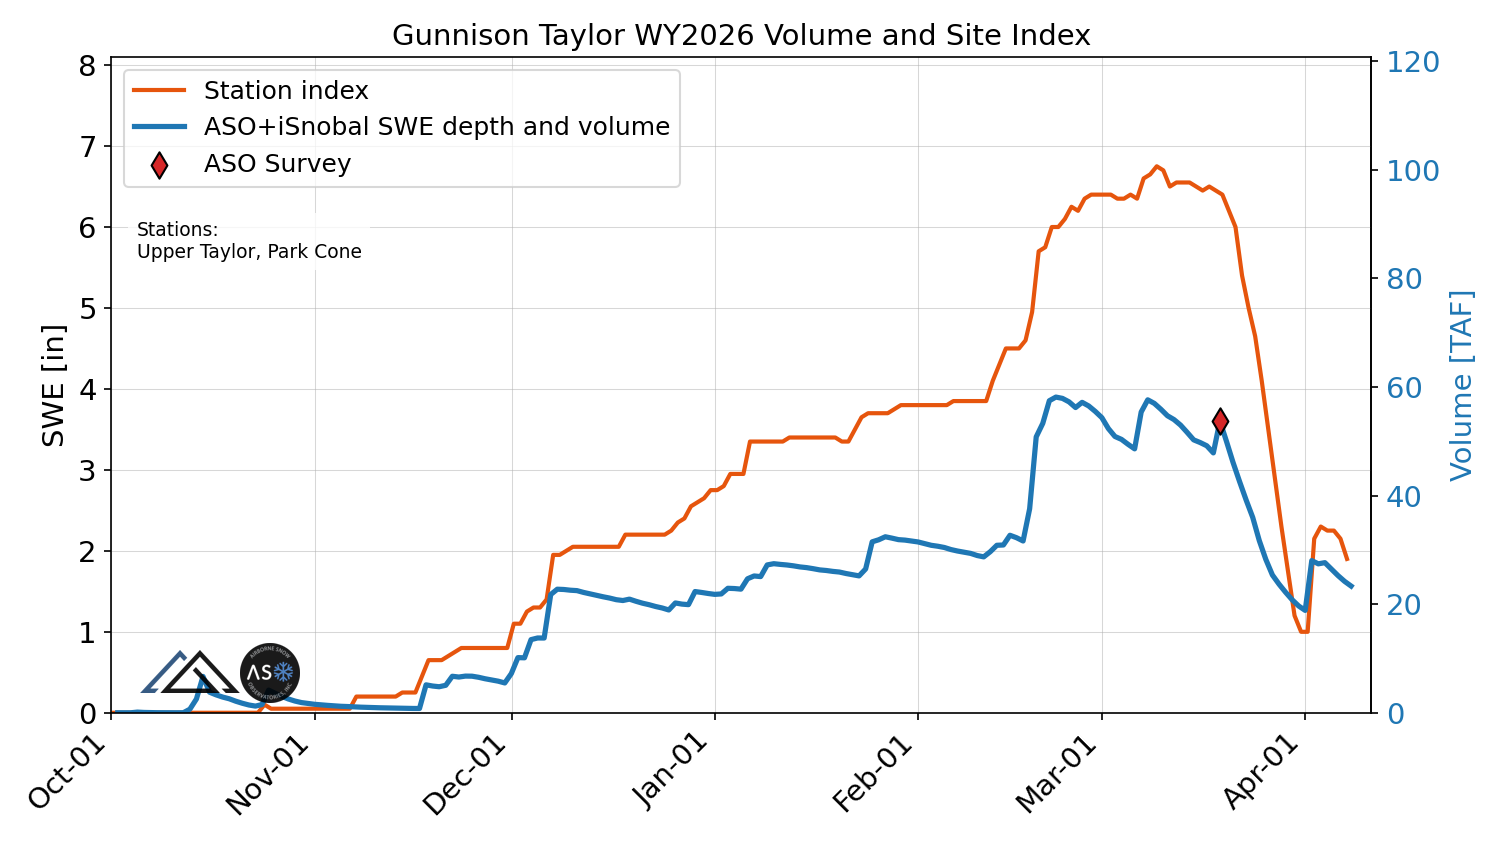
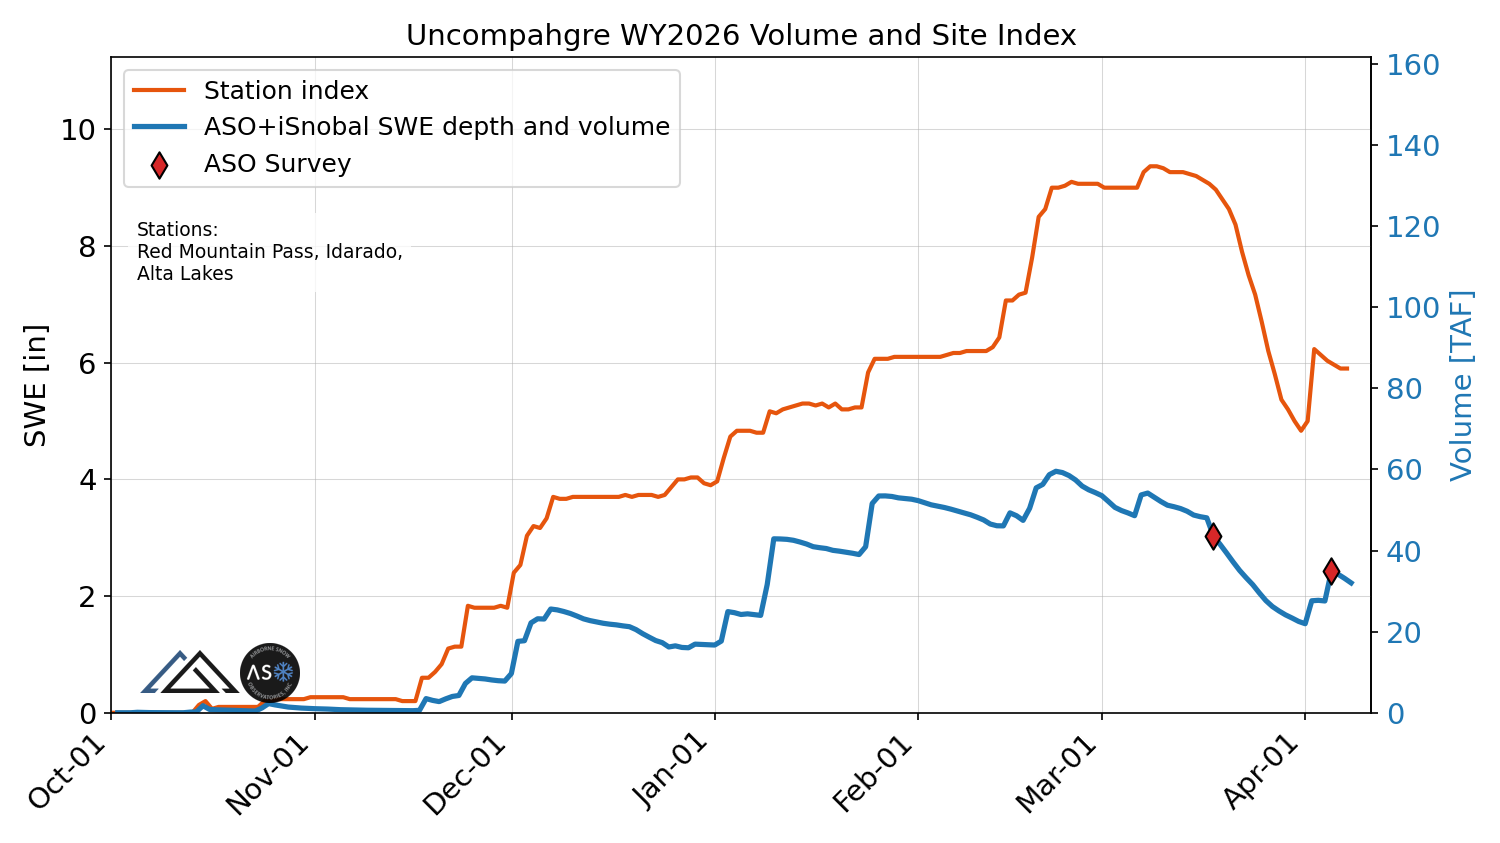
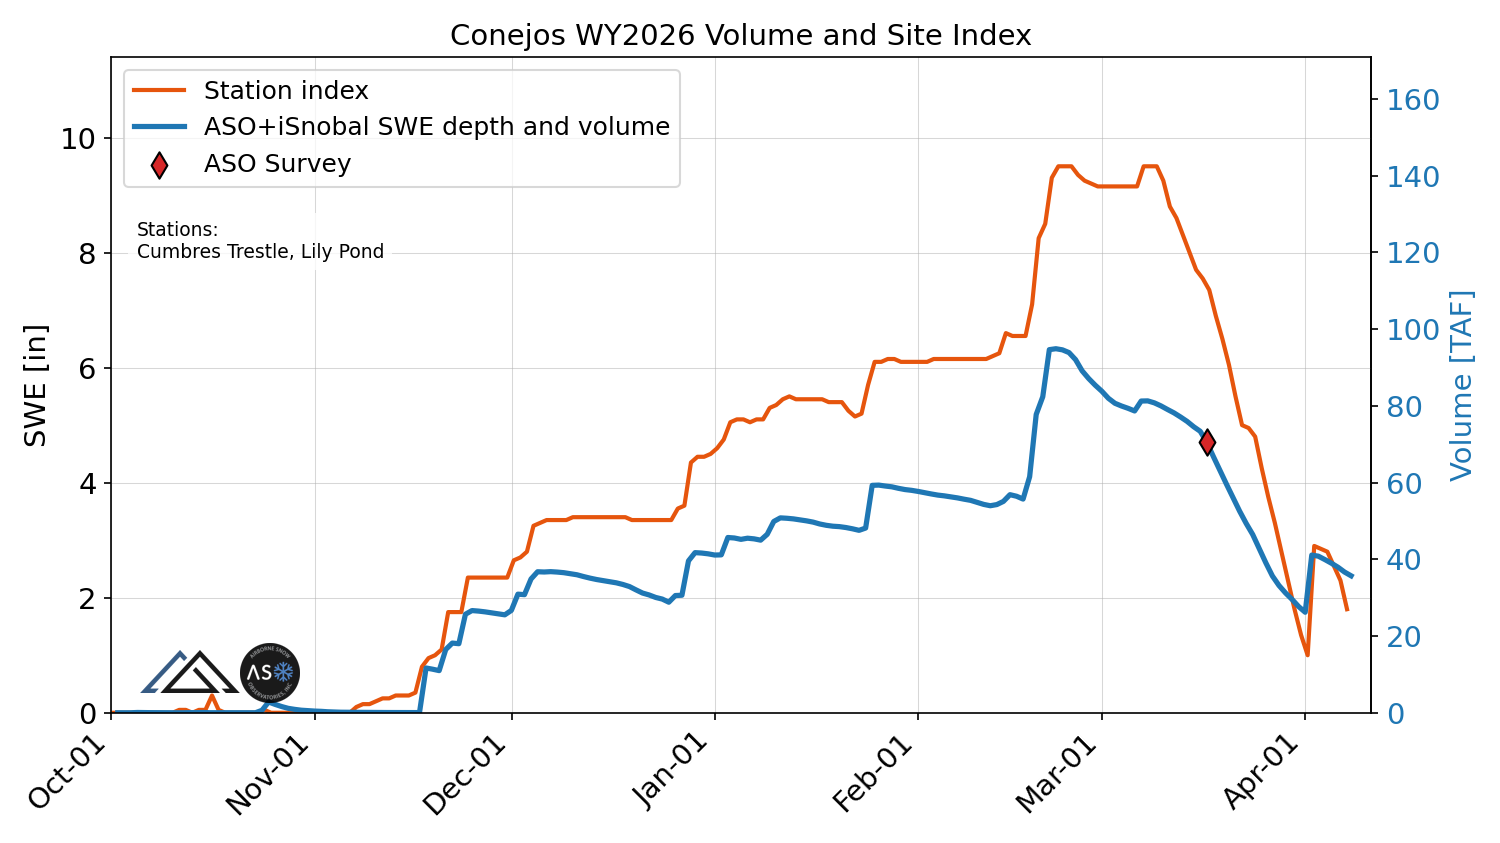
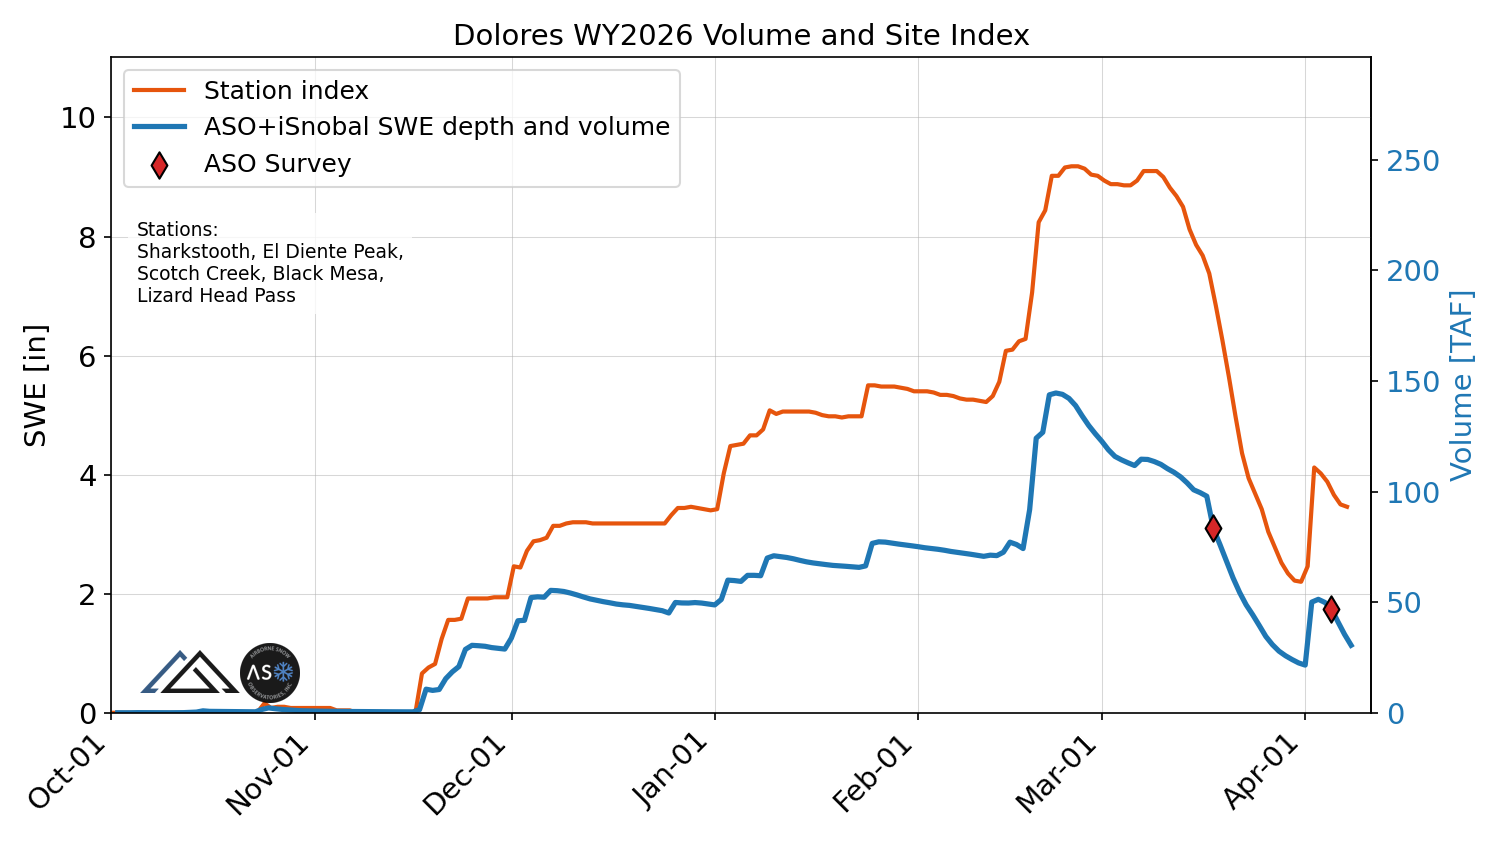
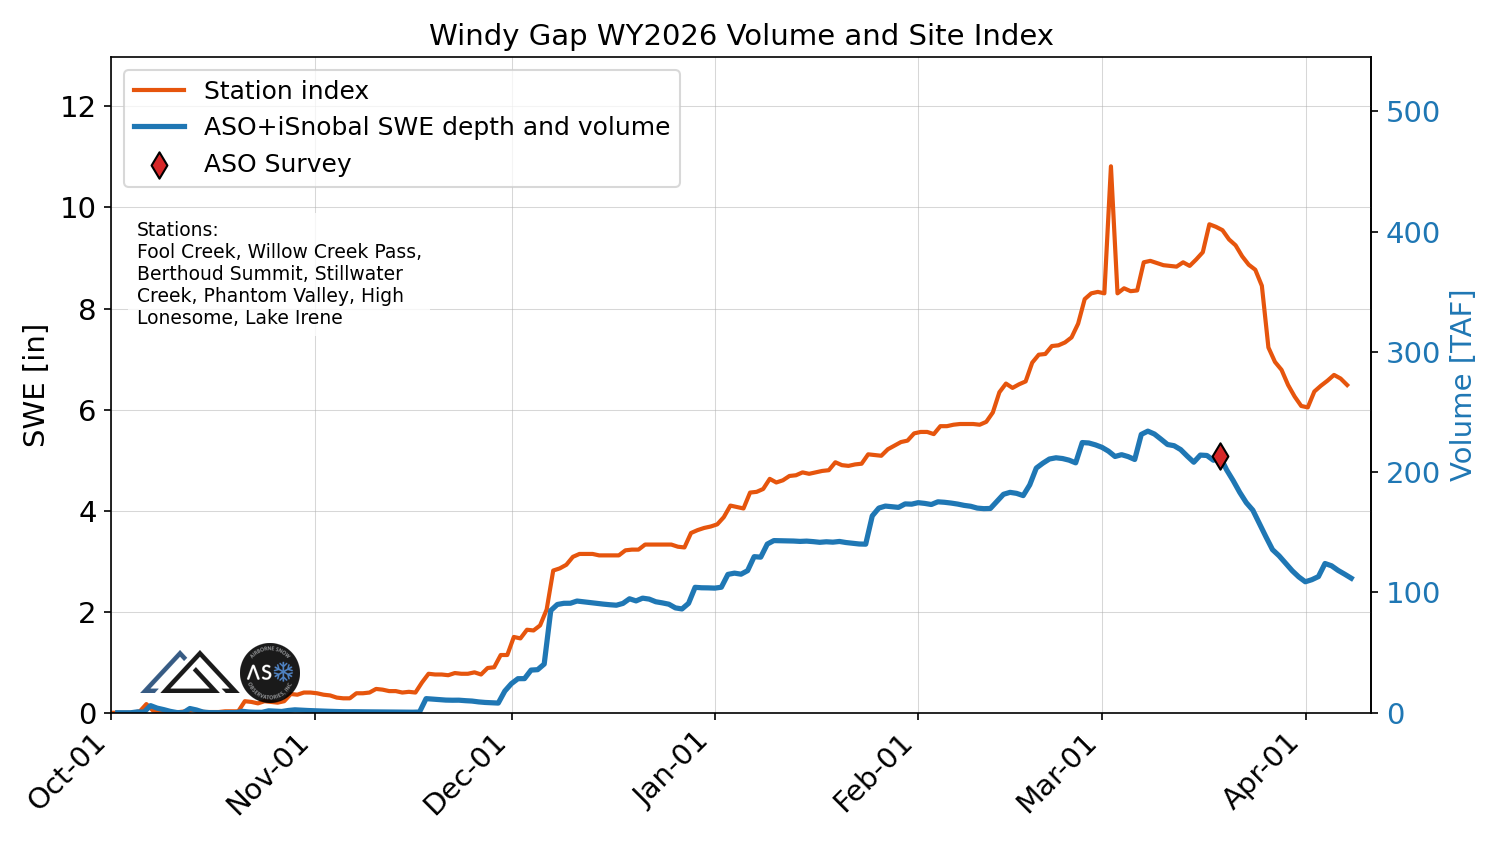
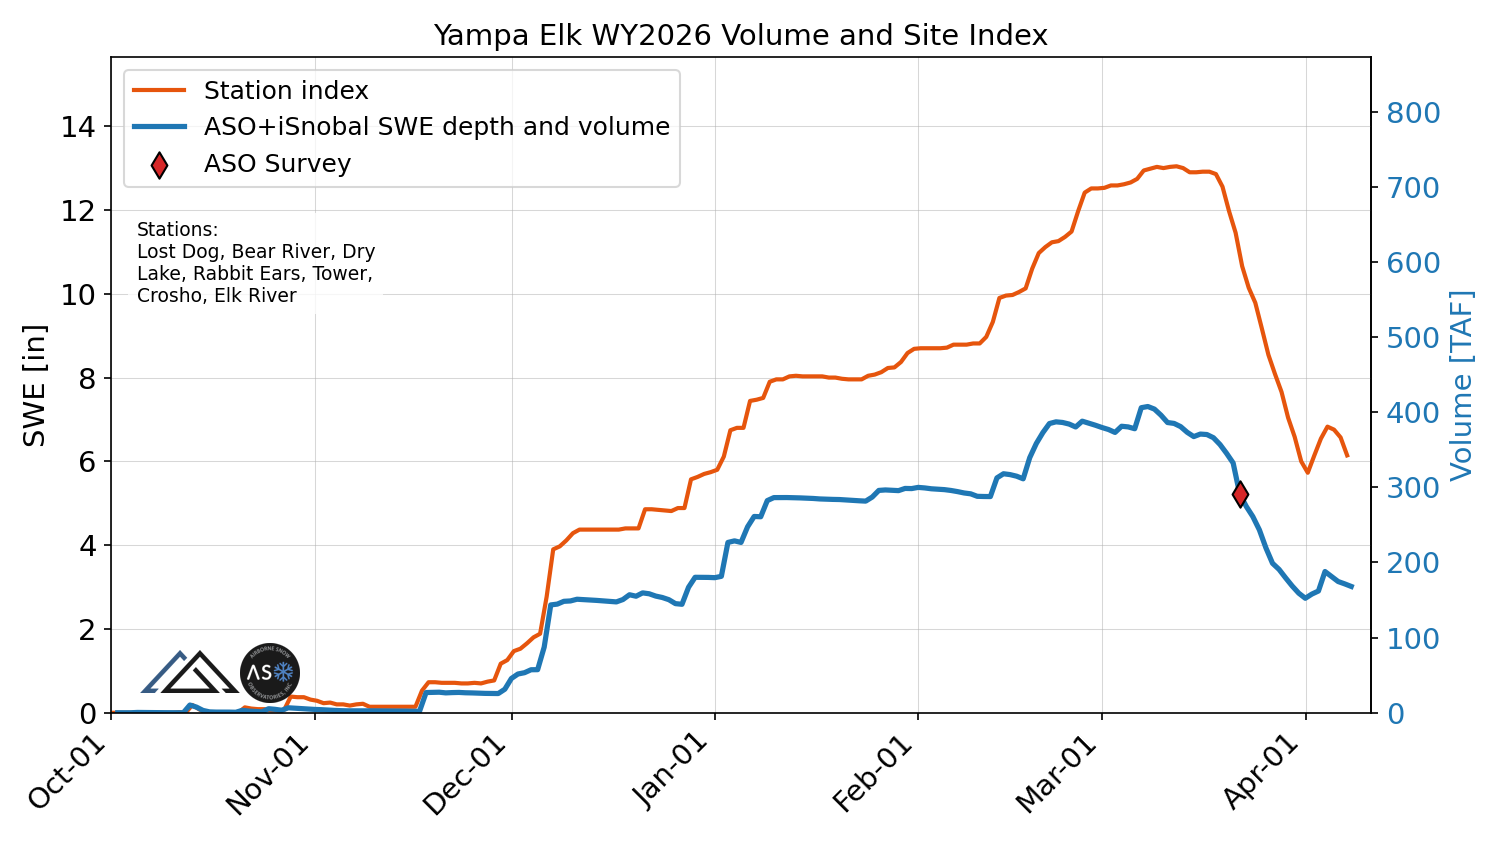
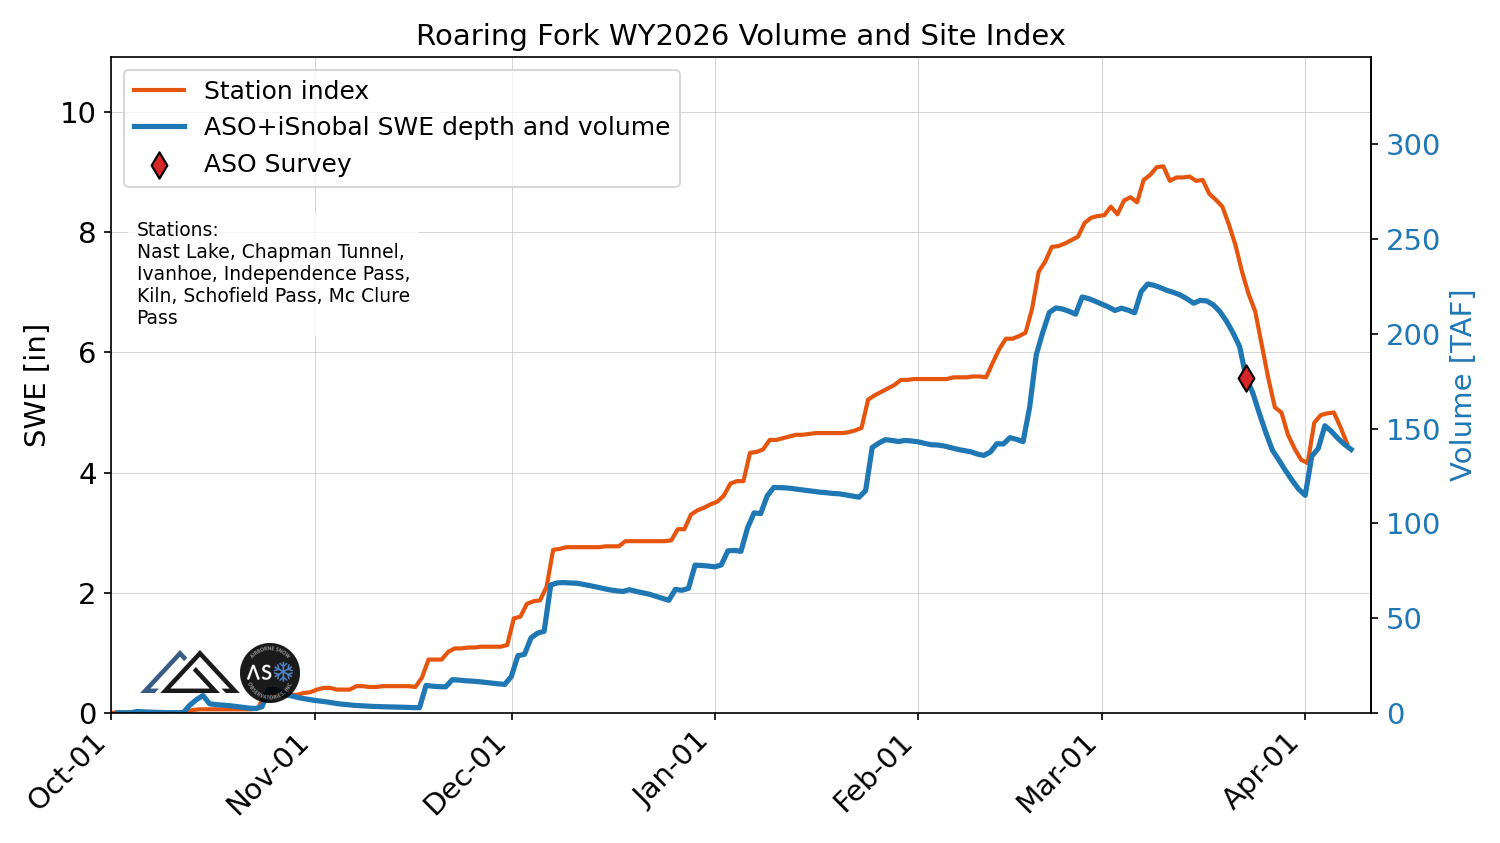
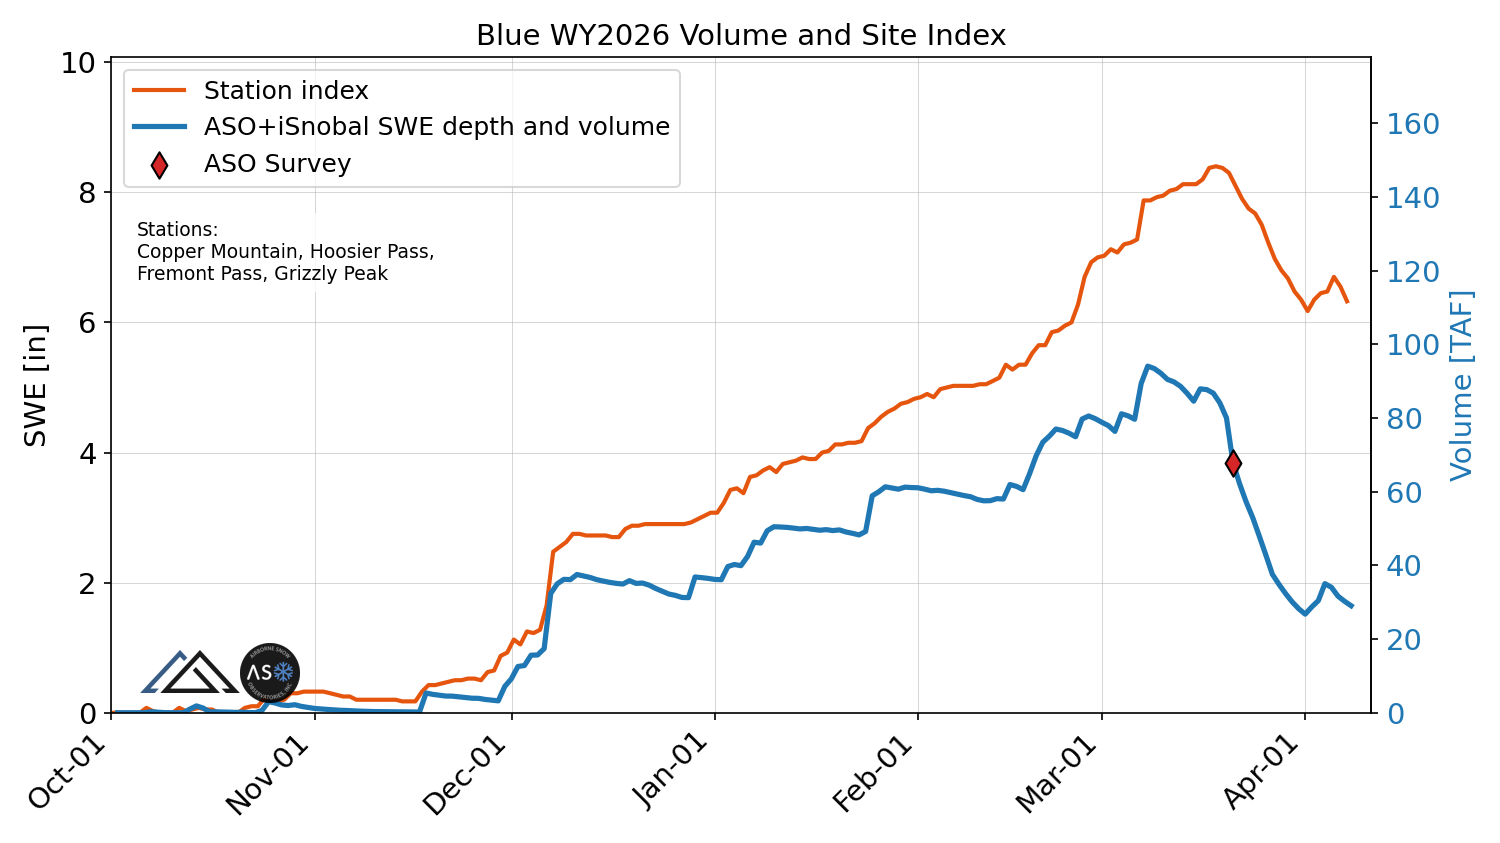
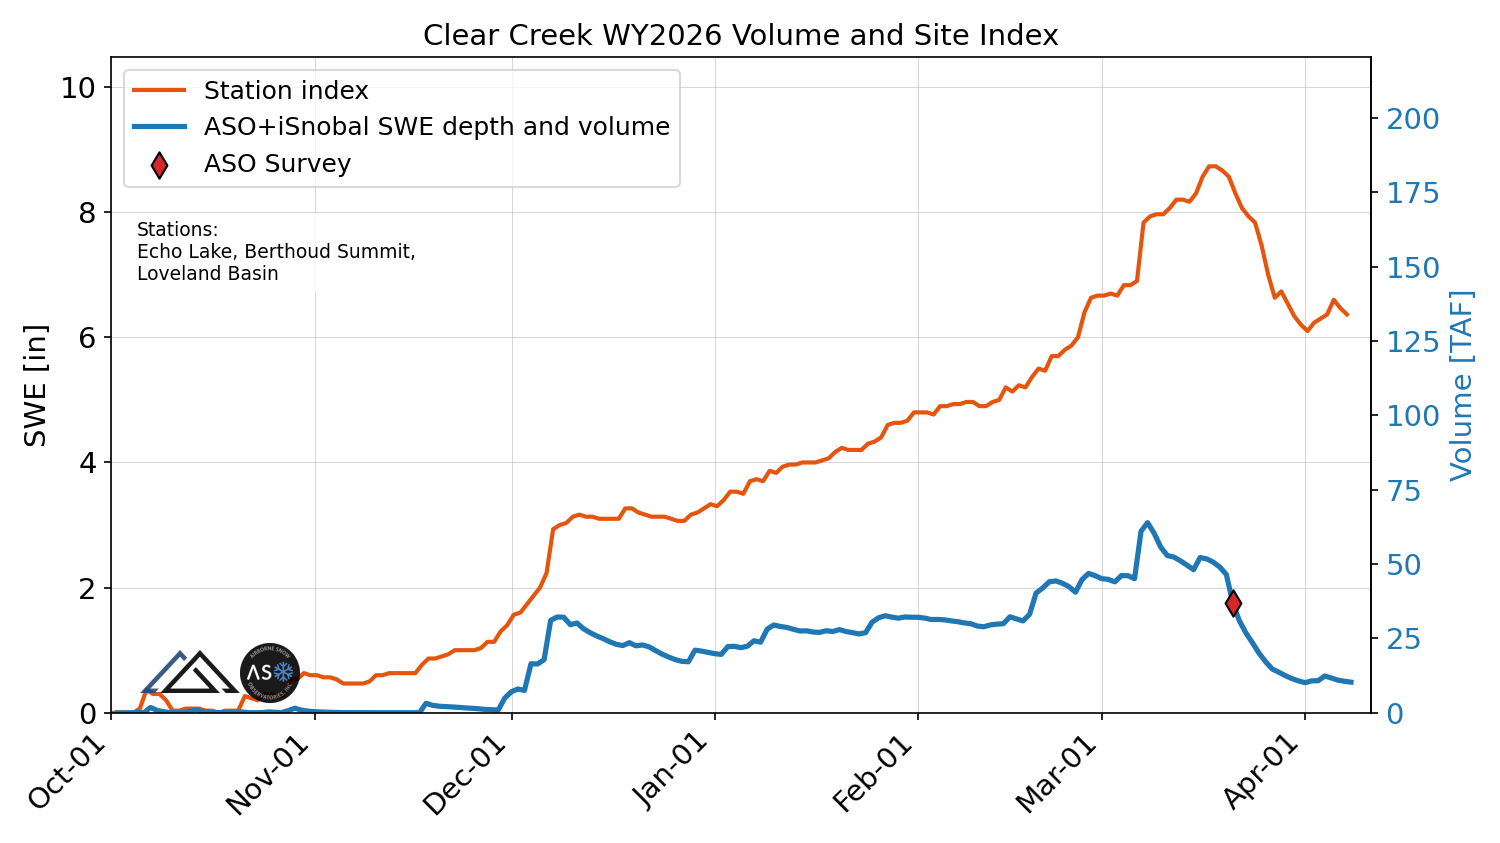
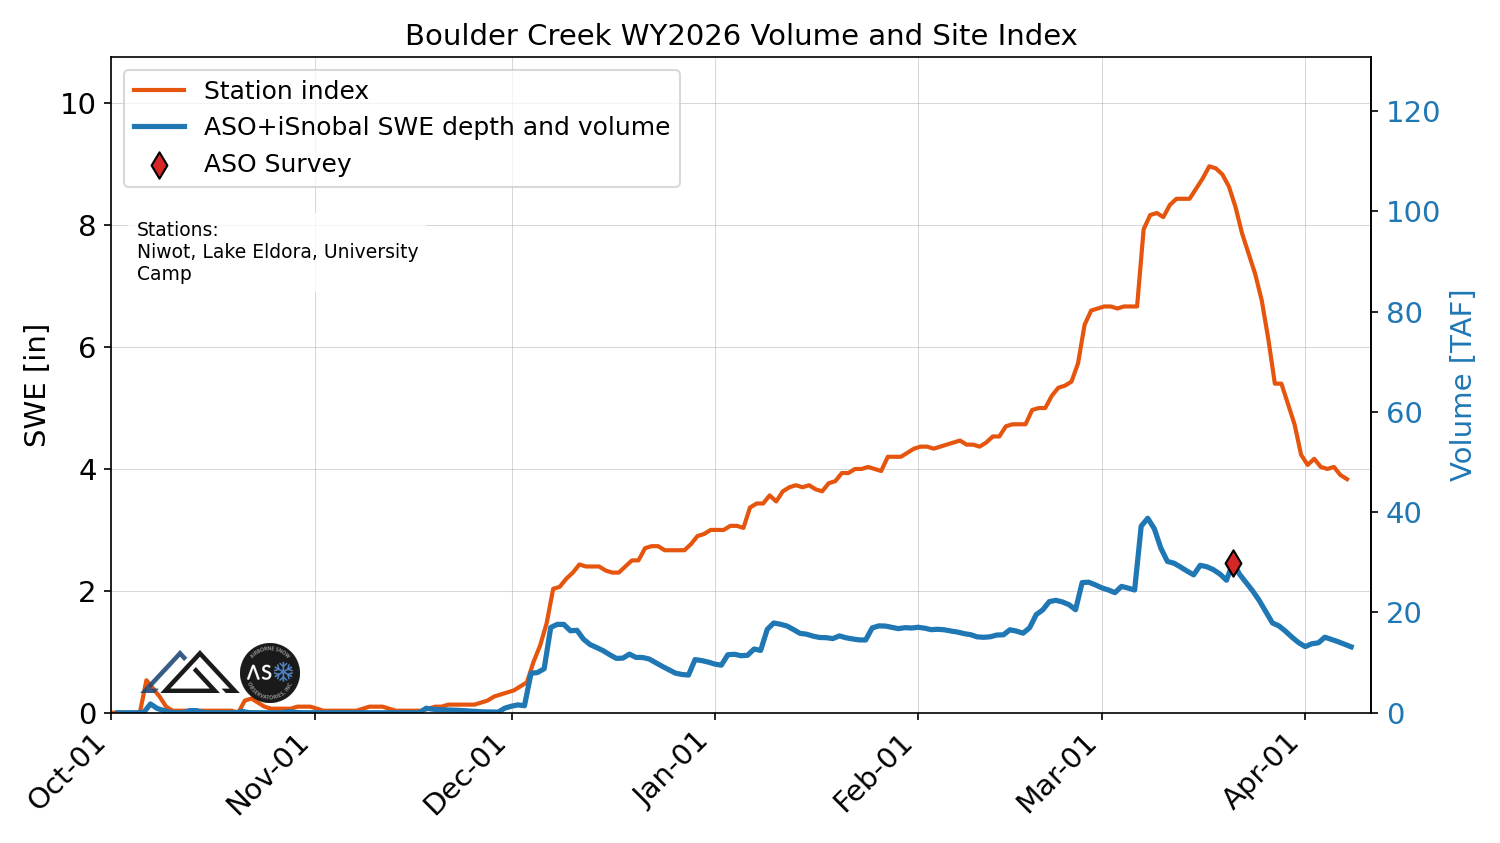
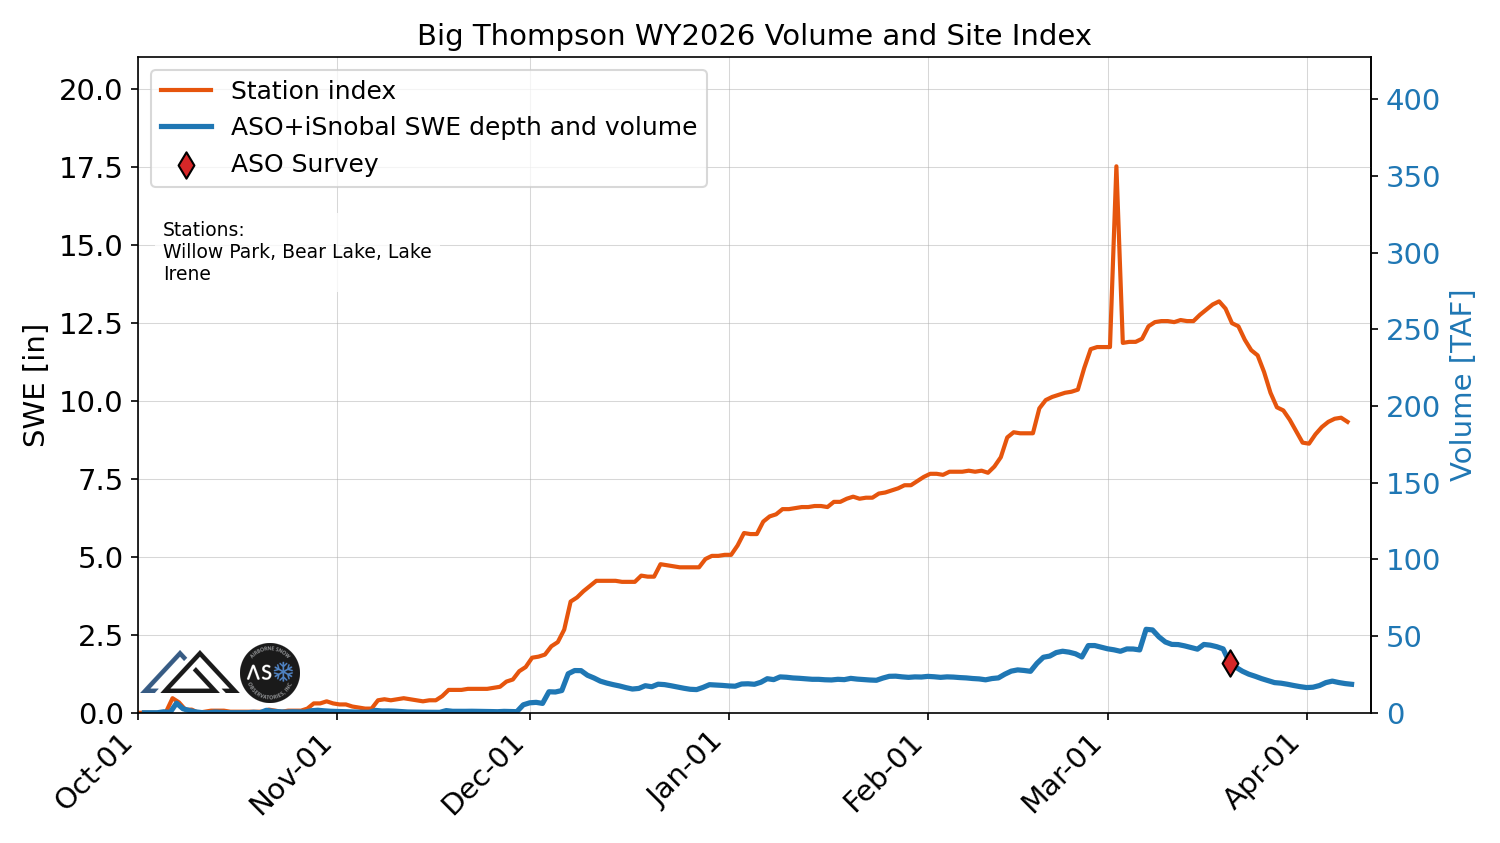
This comparison highlights how the two data sources differ. In some years, SNOTEL and basin SWE line up closely. In others, they do not, including differences in peak timing and how quickly snow melts. These relationships vary from year to year and are difficult to predict in advance.
This comparison helps show how these two snowpack measures relate. While there is some year-to-year consistency, the relationship often varies a lot within and between seasons. In some years, peak snowpack and melt timing line up closely between the two, while in others they are quite different. Many factors influence these differences, making them hard to predict ahead of time.
Ultimately, both sources of information are crucial to understanding our water supply, and a deeper understanding of how they complement each other benefits decision-makers and the general public. The nuances of these differences highlight the benefits of basin scale mapping of snowpack in extreme years like 2026 where traditional statistical methods may provide an incomplete picture of snowpack conditions.
Across multiple data sources, including airborne snow surveys, satellite observations, ground-based monitoring networks, and streamflow forecasts, 2026 is shaping up to be a record low year for snowpack and runoff, with clear implications for reduced water supply, earlier and more constrained runoff, and increased pressure on water operations across Colorado. Many municipalities have already implemented drought response measures, including formal declarations in some areas. At the same time, airborne surveys are highlighting important spatial nuances that are not fully captured in station-based indices, particularly in how snow is distributed across elevations and terrain.
Looking ahead, spring weather will play a critical role in determining final water supply outcomes. While April 1 provides a conventional benchmark, forecast uncertainty remains elevated given current conditions.
A significant portion of Colorado’s water supply comes from springtime precipitation. Late-season storms or cooler conditions could improve runoff
Continued warm and dry weather could accelerate melt and reduce runoff efficiency
Snowpack distribution and timing of melt will be key drivers this year
We will continue to share updates, including graphics and basin-specific insights, as additional data and analysis become available. Data and reporting are available through the Colorado Airborne Snow Measurement program website (ColoradoSnow.org), along with supporting datasets from the NRCS, USGS, CU Boulder, and other partners.
ColoradoSnow.org: reports and basin summaries
ASO data portal: snow surveys and modeled snowpack
USGS Flow Data for supporting conditions and trends
Thanks for reading and, as always, reach out to our program staff with any questions:
Erik Skeie erik.skeie@state.co.us
Page Weil Page.Weil@SpherosEnv.com